
Who won?
Cross-Sector Partnerships are key!
TOP 20 IN TOKYO 2020 OLYMPIC MEDAL COUNT

Sources: https://olympics.com/tokyo-2020/olympic-games/en/results/all-sports/medal-standings.htm / https://www.populationpyramid.net/es/poblaci%C3%B3n-por-pais/2020/ Elaboration: Roberto Salazar, ADN@+ (Gold:100 points. Silver: 10 points. Bronze: 1 point). RankbT: Ranking by Total Number of Medals. RankPop: Ranking by Population. ROC: Russian Olympic Commitee.
TOP 50 IN OLY OLYMPIC MEDALS AND RELATION WITH POPULATION
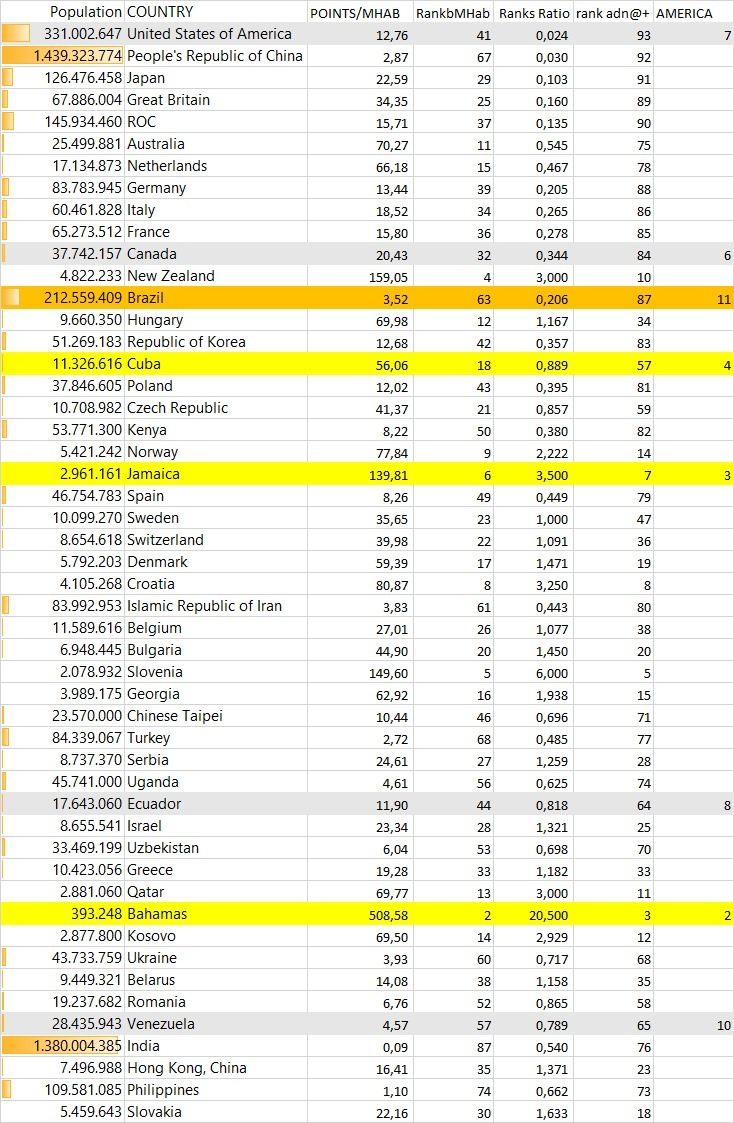
Elaboration: Roberto Salazar, ADN@+
RankbMHab: Ranking by Points Achieved per Million Inhabitants.
RanksRatio: Rank/RankbMHab
rank adn@+: Ranking by RanksRatio
AMERICA: Ranking in America according to RankbMHab
OLYMPIC RANKING IN AMERICA
RANKING BY TOTAL MEDALS, AND ADN@+ RANKING

Elaboration: Roberto Salazar, ADN@+ / 15 American Countries reached at least 1 point.
Yellow: Top 5 in America (Gold)
Gray: Top 6 to 10 in America (Silver)
Dark Yellow: Top 11 to 15 in America (Bronze)
WHO WON?

Elaboration: Roberto Salazar, ADN@+ / 15 American Countries ordered by TankbMHab
In America: the Caribbean Won the Gold/Million Habitants
In the Caribbean: Bermuda Won with 1 Gold per 62985 habitants
The Silver goes to North America: Canada and United States, followed by Ecuador (South America), Grenada (Caribbean), and Venezuela (the Caribbean and South America)
In America, the Bronze/Million Habitants goes to Latin America and the Caribbean (LAC)
Note: Canada is trying to have a position in the Caribbean (Turks and Caicos).
Ecuador is the only country among the 15 without an Atlantic/Caribbean Port.
A DOZEN OF FACTS FOR THE ANALYSIS:
1. Population is correlated in 46% to obtaining Points in Games (Olympic Medals)
2. A regression of Olympic Points = Interception + (Population)*(Number Habitants) only explains 20% of the Victories in Games. Population only explains the Pareto: 20%. DNA is not enough: a DNA@+ is required to win (covering the Pareto Rule of 80% after reaching a 20% level):

3. Without a full DNA@+ process, an average small country in the World, like Bermuda, should expect to raise only 57 points (20% * 286 points+0) by means of its sole participation and independent of its small population: 5 silver and 7 bronze, near 60% of a golden medal. With a full DNA@+ process, they could have reached 2.86 golds. That is the merit of Bermuda and its 1 Gold: They reached 35% of their potential of DNA@+.
4. A country of 20 million habitants should expect to raise 320 points with a full DNA@+ process: 3 golds, and 2 silvers. Ecuador, with 17.6 million habitants should expect, with a full DNA@+ process, to get 316 points (3 gold, 1 silver, and 6 bronze medals). Without a process, and leaving things to chance, the filter of 20% probability would allow Ecuador to get only 60% of a gold medal. That is the merit of Ecuador and its 2 Golds and 1 Silver (210 points). Ecuador reached 66% of its potential, almost twice as much as Bermuda.
5. Ecuador ended 36th in the global ranking and Bermuda ended 63rd.
6. If the United States would leave things to chance and would depend on its DNA only (and would not follow a DNA@+ process) they should expect only 172 points (around 2 golden medals). With a full process, they should expect 8 golds and 4 silvers. The merit of the USA is to have increased its chances and process 5,02 times, by having conquered 30 more golds, and 35 more silvers. The USA not only has the DNA@+ at its full: they also have conquered capital, and income: the two key factors on top of DNA, and processes. With growth, income, and capital, sports can become an industry, and financing it as an investment is a matter of social cohesion, making sports be part of credibility for being a strong global country, top 1 in Olympics, and a world PEACE maker: in Politics, Economics, Associativity, Culture, and Environment).
7. If China would leave things to chance and its DNA only (and would not follow a DNA@+ process) they should expect only 552 points (around 6 golden medals). With a full process, they should expect 27 golds and 3 bronze. The merit of China is to have increased by 1,53 times its top chances, having conquered 11 more golds, 31 more silvers, and 15 more bronze medals. China, after the 80s, started working in a State-Capitalist model that has not only taken its DNA@+ at its full: they also have conquered capital, and income: the other key factors on top of its DNA, and its communist processes. They reached 2nd place because they only got a third of the efficiency of the USA in reaching its potential at its full (in special because markets for sports are different as sports as a policy: financing as an investment are, anyway, good enough for making it become a strong internal PEACE maker: in some of its domestic Politics, Economics, Associativity, Culture, and Environment).
8. In the case of Cuba, chance and DNA would only get them 1 Gold. A full DNA@+ would allow them to get 3 golds. The merit of Cuba is doubling its chances, by conquering 6 golds, 3 silvers, and 5 bronze medals, reaching 2.08 times its potential. With a capitalist model, Cuba and its DNA, plus a full DNA@+ process could reach 15 golds, following the Standard of the 5.02 times more efficiency of the USA, compared to the 1.53 more efficiency only of China.
9. In the case of Rusia, chances would get them 1 gold only, and a full process would give them 5 golds. They reached not 531 points, but 2239, achieving 4.32 times its potential. No doubt that it is a strong multiplier, but they still lack the strength of the USA that is closer to Cuba, and could be used as a better benchmark for getting full potential.
10. The case of Mexico is similar to the one in Russia: the problem is that Mexico could have got among 1 to 5 golds, and got only 4 bronze, achieving only 1% of its potential. Mexico could see, the same as Cuba, more to the USA than to Russia and China in terms of sports. They are neighbors with the USA and could see things from a different perspective for unlocking its potential at its full.
11. In the case of Argentina, it could have 1 to 4 golds. Unfortunately, they only got 1 silver and 2 bronze medals, reaching only 3% of their potential.
12. Other countries can be seen here:

HOW TO WIN?
A. If the interest is to become champions, and following a model with strong multipliers, the first benchmark could be the USA: 502% of potency for increase, better than Rusia with 432%, Cuba 208% or China 153% (after correcting for population and DNA), another model could be Brazil, with a 116% multiplier, after correcting for those factors.
Unfortunately for China and the USA, there are a couple of more recent and interesting models coming ahead after this analysis: Great Britain and in special the host: Japan, with respective multipliers of 815% and 998%. Both prepared their countries not only out of chances, making the best of their DNAs, but also by having capital, organization, and competitiveness, based on technology, research, and a long-run process.
B. The result obtained by the host should be seen in the next Olympic Games in France, in 3 years, and should perform as well as the UK / Great Britain has done after almost 10 years after they hosted. Brazil has lost momentum because of the lack of order of Latin America maybe, as can be seen in the results of the other "big" countries in the region (Argentina and Mexico in special).
Following the path of the UK and re-orienting towards the learnings of Japan, more than comparing to size, seems the path to follow. It is not about one gold taken by a process plus chance and some DNA, it is about DNA@+Capital, freedom, and order under liberty and competitiveness, productivity, and discipline.
If we see this, under that light, the ranking is correlated in 87% with the total of medals:

C. A country that wins on average, 1 or 2 golds per day, can expect to start and keep itself among the top 5 countries, but if it also wins silver and bronze in a 10/1 proportion, it can be the champion at the end of the games with almost 94% of probability.
WINNING THE NEXT GAME?: CONCLUSSIONS...
I. The game is to produce Gold (100 points for each medal), Silver (10 points for each medal), and Bronze (1 point each Medal):

II. Remember, it is about quality but also quantity, not necessarily size:

III. If you belong to a country with 18 million habitants, I would like to have 10 Golds, like the Netherlands and Europe that show that getting 1 gold per day, 1 silver per day, and 1 bronze daily is the recipe for being a top ten.
RECOMMENDATIONS
What should we start doing in Latin America and the Caribbean?
It seems that the Caribbean is showing us that way; maybe South America should learn to see more to the Caribbean, and see eye to eye, with them, towards the UK, and Europe.
South America can always look to the Pacific: Asia, China, and the USA off course.
If you ask the author about a favorite, it would be the UK first, the Netherlands, second, and the USA third, so one can catch up in the long run with Asia, in the median run with Europe, and in the short run with America as a whole.
While that arrives, let's enjoy today our results in America, and let's enjoy the results of Ecuador, the median country of Latin America, and its top 6 in the Continent after the USA, Canada, Brazil, Cuba, and Jamaica!

Cross-Sector Partnerships are key!
Enjoy!
Comentarios